영어로 배우는 중학교 수학 - 이차방정식의 그래프 [ 영문 ] / The Graph of Quadratic Equation
작성자CLARK작성시간09.11.22조회수646 목록 댓글 0
Let's Learn About the Graph of Quadratic Equation !
영어로 중학교 수학 - 이차방정식의 그래프에 대하여 배워봐요.
아래를 클릭하시면 비디오도 보실 수 있습니다.
============================================================================================================
Exploring Quadratic Functions
Work with a partner. Complete a table of values and plot points.
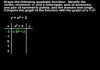
1. A. Graph the equations y = x2 and y = 3x2. B. How are the graphs in part (A) alike? Different?
2. A. Graph the equations y = - x2 and y = - 3x2. B. How are the graphs in part (A) different from the graphs in Question 1? How are they like the graphs in Question 1?
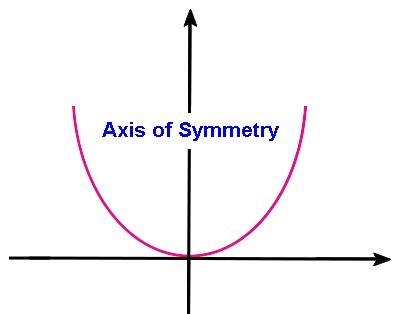
Quadratic Functions The graphs you analyzed in the above are all examples of parabolas. If you draw a parabola on a piece of paper, you can fold the paper down the middle of the parabola and the two sides will match exactly. The line down the middle of the parabola is the axis of symmetry. Each parabola that you have seen is the graph of a quadratic function.
Quadratic Function For a Example : y = 2x2 , y = x2 + 2 , y = - x2 - x - 3
When a quadratic function is written in the form y = ax2 + bx + c, it is in standard form.
4. Name the values of a, b and c for each quadratic function. a. y = 3x2 – 2x + 5 b. y = 3x2 c. y = -0.5x2 + 2x
5. Write each quadratic function in standard form. a. y = 7x + 9x2 – 4 b. y = 3 – x2
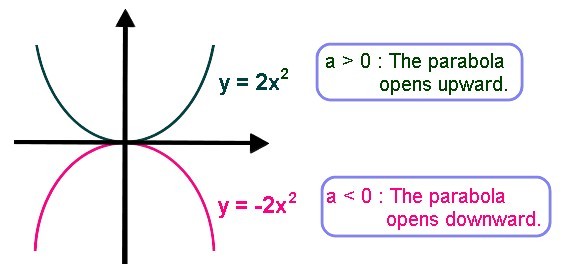
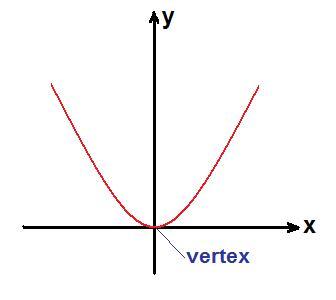
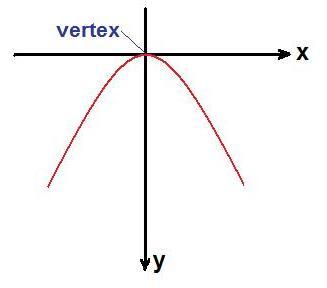
The Role of “a” When you graph a quadratic function, if the value of a is positive, the parabola opens upward. If the value of a is negative, the parabola opens downward.
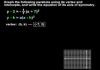
E X A M P L E 1 Make a table of values and graph the quadratic functions y = 2x2 and y = -2x2.
6. What is the axis of symmetry for the graphs in Example 1 ? 7. What would happen to the graph of y = 2x2 if you could fold the graph over the x-axis ? Explain.
The highest or lowest point on a parabola is called the vertex of the parabola. When a parabola opens upward, the y-coordinate of the vertex is the minimum value of the function. When a parabola opens downward, the y-coordinate of the vertex is the maximum value of the function.
8. Answer these questions for y = -3x2 and y = 4x2. a. What is the value of a ? b. In which direction does each graph open ? c. Is the y-coordinate of the vertex a minimum or a maximum value of the function ?
9. Summarize what you know so far about how the value of a affects the parabola.
The value of a also affects the width of a parabola.
|