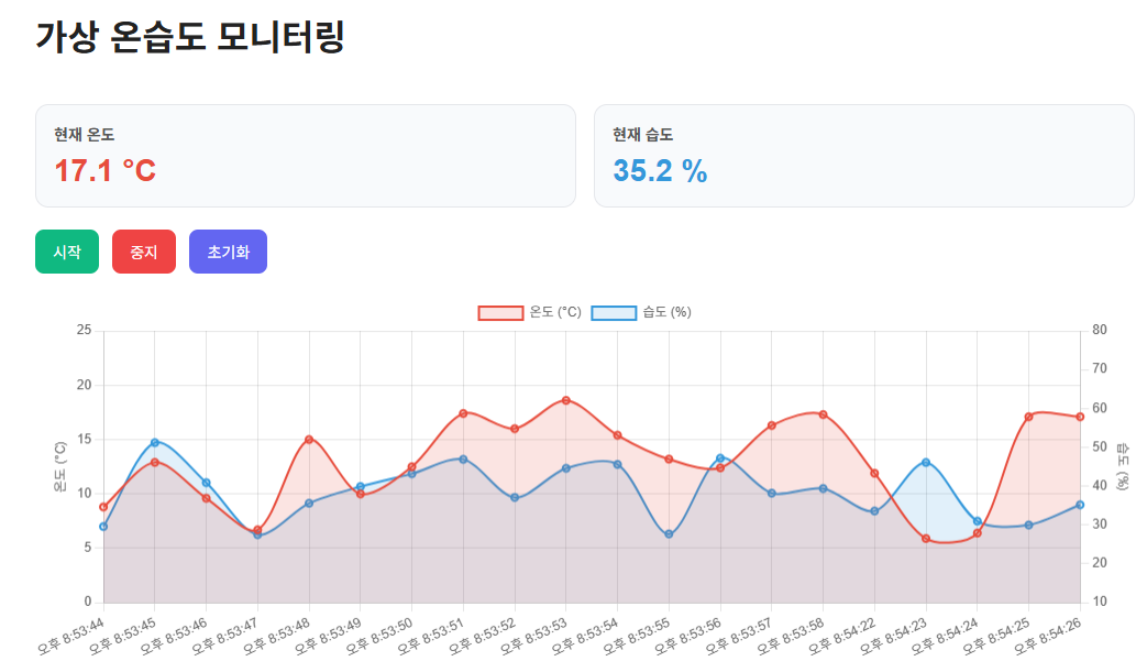
김명환 님이 처음에 만든 프로그램 입니다.
가상 데이터 가지고 시뮬레이션 프로그램 한 겁니다.
<!DOCTYPE html>
<html lang="ko">
<head>
<meta charset="UTF-8" />
<meta name="viewport" content="width=device-width, initial-scale=1.0" />
<title>가상 온습도 그래프</title>
<script src="https://cdn.jsdelivr.net/npm/chart.js"></script>
<style>
body {
font-family: Arial, sans-serif;
background: #f4f7fb;
margin: 0;
padding: 30px;
}
.container {
max-width: 1000px;
margin: 0 auto;
background: white;
padding: 24px;
border-radius: 16px;
box-shadow: 0 8px 24px rgba(0,0,0,0.08);
}
h1 {
margin-bottom: 40px;
color: #222;
}
p {
color: #666;
margin-bottom: 20px;
}
.info-box {
display: flex;
gap: 16px;
margin-bottom: 20px;
flex-wrap: wrap;
}
.card {
flex: 1;
min-width: 180px;
background: #f8fafc;
border-radius: 12px;
padding: 16px;
border: 1px solid #e5e7eb;
}
.card h3 {
margin: 0 0 8px;
font-size: 14px;
color: #555;
}
.card .value {
font-size: 28px;
font-weight: bold;
}
.temp {
color: #e74c3c;
}
.hum {
color: #3498db;
}
.btn-group {
margin-bottom: 20px;
}
button {
border: none;
padding: 10px 16px;
margin-right: 8px;
border-radius: 8px;
cursor: pointer;
font-size: 14px;
}
.start-btn {
background: #10b981;
color: white;
}
.stop-btn {
background: #ef4444;
color: white;
}
.reset-btn {
background: #6366f1;
color: white;
}
canvas {
margin-top: 10px;
}
</style>
</head>
<body>
<div class="container">
<h1>가상 온습도 모니터링</h1>
<div class="info-box">
<div class="card">
<h3>현재 온도</h3>
<div class="value temp" id="tempValue">-- °C</div>
</div>
<div class="card">
<h3>현재 습도</h3>
<div class="value hum" id="humValue">-- %</div>
</div>
</div>
<div class="btn-group">
<button class="start-btn" xxxxonclick="startMonitoring()">시작</button>
<button class="stop-btn" xxxxonclick="stopMonitoring()">중지</button>
<button class="reset-btn" xxxxonclick="resetChart()">초기화</button>
</div>
<canvas id="tempHumChart" height="100"></canvas>
</div>
<script>
const labels = [];
const tempData = [];
const humData = [];
const maxDataCount = 20; // 그래프에 최대 20개 데이터만 유지
let intervalId = null;
const ctx = document.getElementById('tempHumChart').getContext('2d');
const tempHumChart = new Chart(ctx, {
type: 'line',
data: {
labels: [],
datasets: [
{
label: '온도 (°C)',
data: [],
borderColor: '#e74c3c',
backgroundColor: 'rgba(231, 76, 60, 0.15)',
borderWidth: 2,
tension: 0.3,
fill: true,
yAxisID: 'y'
},
{
label: '습도 (%)',
data: [],
borderColor: '#3498db',
backgroundColor: 'rgba(52, 152, 219, 0.15)',
borderWidth: 2,
tension: 0.3,
fill: true,
yAxisID: 'y1'
}
]
},
options: {
responsive: true,
interaction: {
mode: 'index',
intersect: false
},
stacked: false,
plugins: {
legend: {
position: 'top'
}
},
scales: {
y: {
type: 'linear',
position: 'left',
title: {
display: true,
text: '온도 (°C)'
},
min: 0,
max: 25
},
y1: {
type: 'linear',
position: 'right',
title: {
display: true,
text: '습도 (%)'
},
min: 10,
max: 80,
grid: {
drawOnChartArea: false
}
}
}
}
});
function getCurrentTime() {
const now = new Date();
return now.toLocaleTimeString();
}
function generateTemp() {
// 20 ~ 30도 사이 랜덤
return (20 + Math.random() * 10).toFixed(1);
}
function generateHumidity() {
// 40 ~ 70% 사이 랜덤
return (40 + Math.random() * 30).toFixed(1);
}
function addData() {
const now = new Date().toLocaleTimeString();
const temp = parseFloat((5 + Math.random() * 14).toFixed(1));
const hum = parseFloat((25 + Math.random() * 30).toFixed(1));
tempHumChart.data.labels.push(now);
tempHumChart.data.datasets[0].data.push(temp);
tempHumChart.data.datasets[1].data.push(hum);
if (tempHumChart.data.labels.length > maxDataCount) {
tempHumChart.data.labels.shift();
tempHumChart.data.datasets[0].data.shift();
tempHumChart.data.datasets[1].data.shift();
}
document.getElementById('tempValue').textContent = `${temp.toFixed(1)} °C`;
document.getElementById('humValue').textContent = `${hum.toFixed(1)} %`;
tempHumChart.update('none');
}
function startMonitoring() {
if (intervalId) return;
addData(); // 시작 누르면 즉시 1개 추가
intervalId = setInterval(addData, 1000);
}
function stopMonitoring() {
clearInterval(intervalId);
intervalId = null;
}
function resetChart() {
stopMonitoring();
tempHumChart.data.labels = [];
tempHumChart.data.datasets.forEach(d => d.data = []);
document.getElementById('tempValue').textContent = '-- °C';
document.getElementById('humValue').textContent = '-- %';
tempHumChart.update();
document.getElementById('tempValue').textContent = '-- °C';
document.getElementById('humValue').textContent = '-- %';
tempHumChart.update();
}
</script>
</body>
</html>