from nicegui import ui
import random
# -----------------------------
# 센서 데이터 (예시)
# -----------------------------
temperature = 25
humidity = 50
gas = 10
# -----------------------------
# UI 카드
# -----------------------------
with ui.row().classes('w-full p-4 gap-4'):
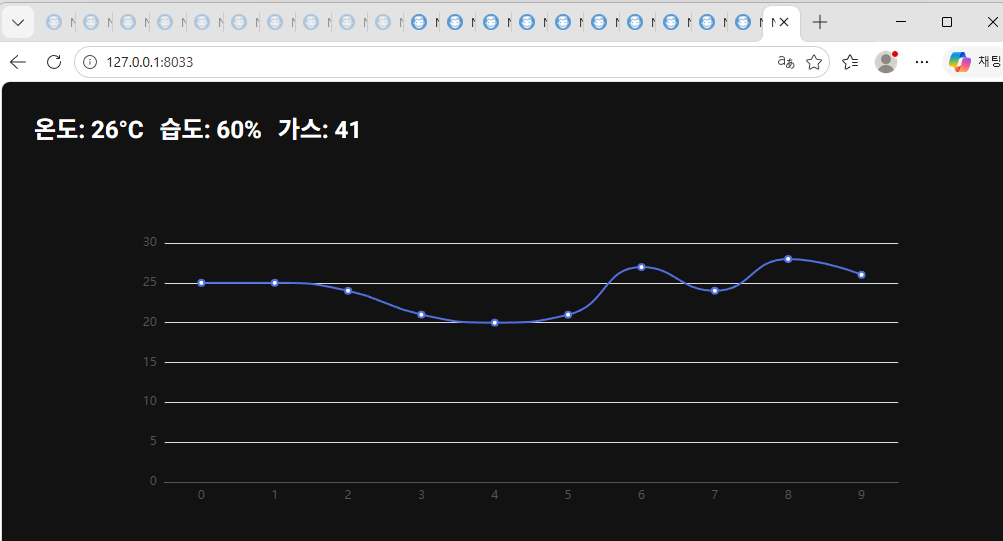
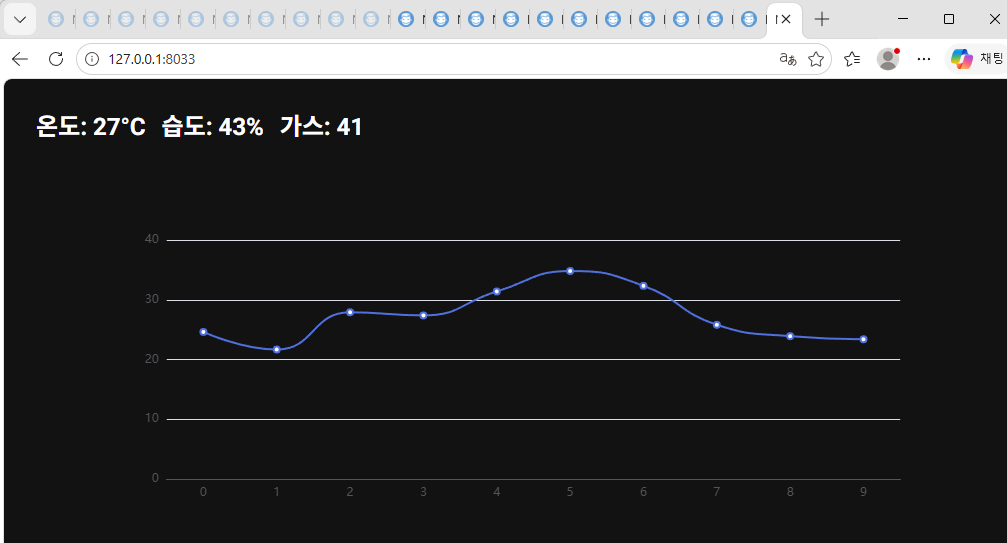
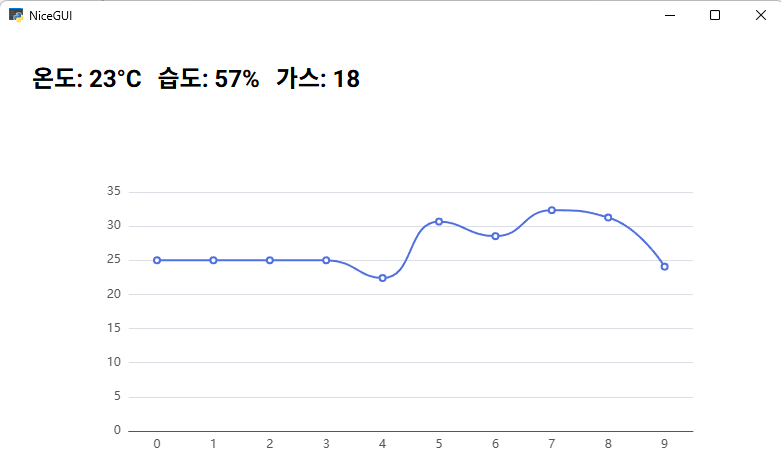
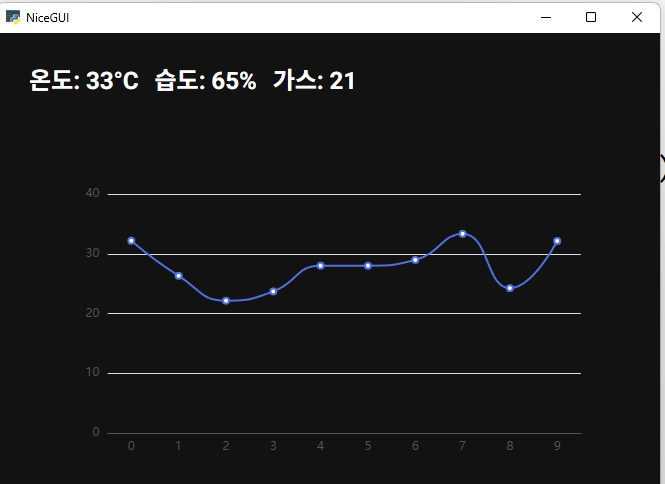
temp_label = ui.label('온도: 0°C').classes('text-2xl font-bold')
hum_label = ui.label('습도: 0%').classes('text-2xl font-bold')
gas_label = ui.label('가스: 0').classes('text-2xl font-bold')
# -----------------------------
# 실시간 차트
# -----------------------------
temp_data = [25] * 10
chart = ui.echart({
'xAxis': {'type': 'category', 'data': list(range(10))},
'yAxis': {'type': 'value'},
'series': [{
'type': 'line',
'data': temp_data,
'smooth': True
}]
}).classes('w-full h-96')
# -----------------------------
# 데이터 업데이트 (IoT 시뮬레이션)
# 실제로는 Arduino / Raspberry Pi 연결하면 됨
# -----------------------------
def update():
global temp_data
# 센서 값 (랜덤 시뮬레이션)
t = random.randint(20, 35)
h = random.randint(40, 70)
g = random.randint(5, 50)
# UI 업데이트
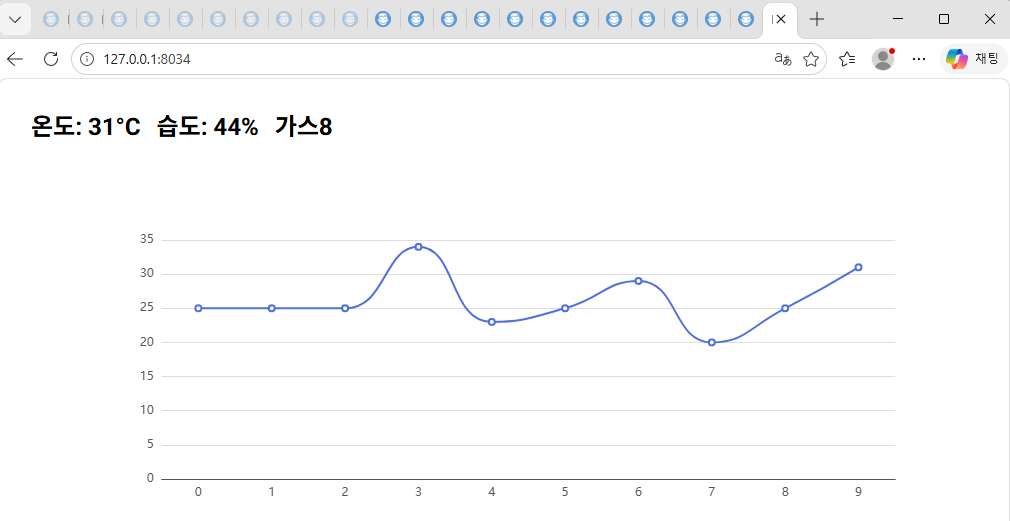
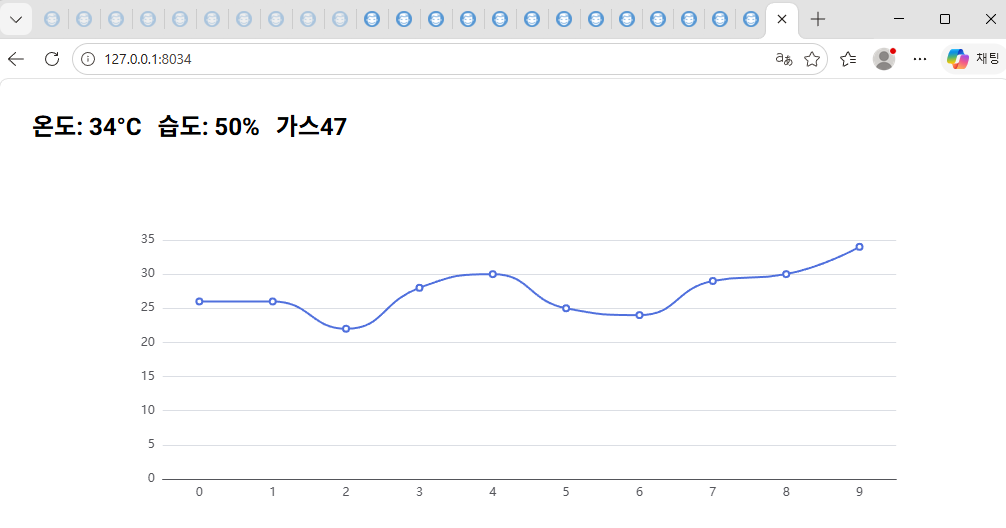
temp_label.text = f'온도: {t}°C'
hum_label.text = f'습도: {h}%'
gas_label.text = '가스{}'.format(g)#f'가스: {g}'
# 차트 업데이트
temp_data.append(t)
temp_data.pop(0)
chart.options['series'][0]['data'] = temp_data
chart.update()
ui.timer(1.0, update)
ui.run(native=True)
앱에서

웹에서