from collections import Counter
import matplotlib.pyplot as plt
import pandas as pd
ora_alert = open("c:\\data\\alert_log.txt")
ora_text = ora_alert.read()
lines = ora_text.split()
def find_errors():
error = []
for word in lines:
if 'ORA-' in word:
error.append(word.strip(':'))
return error
def create_error_df(error):
return pd.DataFrame(list(Counter(error).items()), columns=['에러번호', '건수'])
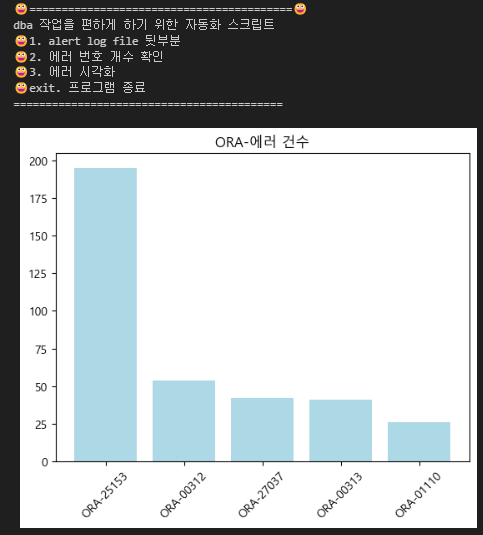
def show_graph(df_error):
df_sort = df_error.loc[ df_error.건수 >= 20 , : ].sort_values(by='건수', ascending=False)
x = df_sort.loc[ :, ['에러번호']]
y = df_sort.loc[ : , ['건수']]
plt.rcParams['font.family'] = 'Malgun Gothic'
plt.bar(x['에러번호'], y['건수'], color='lightblue')
plt.xticks(rotation=45)
plt.title('ORA-에러 건수')
plt.show()
while True:
print("😀=========================================😀")
print('dba 작업을 편하게 하기 위한 자동화 스크립트')
print('😀1. alert log file 뒷부분')
print('😀2. 에러 번호 개수 확인')
print('😀3. 에러 시각화')
print('😀exit. 프로그램 종료')
print('==========================================')
num = input('수행할 작업 번호 입력 : ')
if num == '1':
print(ora_text[-700:])
break
elif num == '2':
print('전체 목록을 보려면 all을 입력하세요')
errorNum = input('에러 번호를 입력하세요 : ')
if errorNum != 'all':
print(errorNum, 'occurs', ora_text.count(errorNum), 'times')
break
else:
error = find_errors()
df_error = create_error_df(error)
print(df_error)
break
elif num == '3':
error = find_errors()
df_error = create_error_df(error)
show_graph(df_error)
break
elif num == 'exit':
break
else:
print('잘못된 번호입니다')