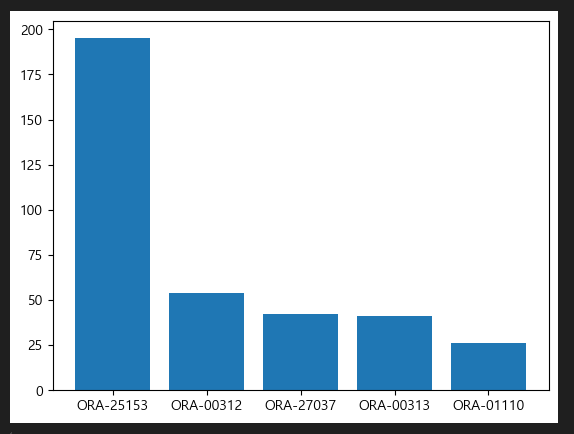
| from collections import Counter import pandas as pd import matplotlib.pyplot as plt oracle_alert = open("C:\\data\\alert_log.txt", encoding='utf8') oracle_text=oracle_alert.read() lines = oracle_text.split() error_list=[] while True: print("=========================================") print('dba 작업을 편하게 하기 위한 자동화 스크립트') print('1. alert log file 뒷부분') print('2. 막대 그래프(20건이 넘게 반복 발생 된 오라클 에러 번호 및 횟수 확인)') print('3. 전체 에러 메시지 종류 개수 세기') print('9. 프로그램 종료') print('==========================================') num=input('번호를 입력해주세요 : ') if num == '1': print(oracle_text[-700:]) break elif num == '2': for i in lines: if 'ORA-' in i: error_list.append(i.strip(':')) q1_error=pd.DataFrame(list(Counter(error_list).items()),columns=['에러번호','건수']) q1_sort=q1_error.loc[q1_error.건수 >= 20, : ].sort_values(by='건수', ascending=False) x=q1_sort.loc[ :, ['에러번호']] y=q1_sort.loc[ :, ['건수']] plt.rcParams['font.family'] = 'Malgun Gothic' plt.bar (x['에러번호'], y['건수']) break elif num == '3': for i in lines: if 'ORA-' in i: error_list.append(i.strip(':')) print(Counter(error_list)) break elif num =='9': break |
다음검색