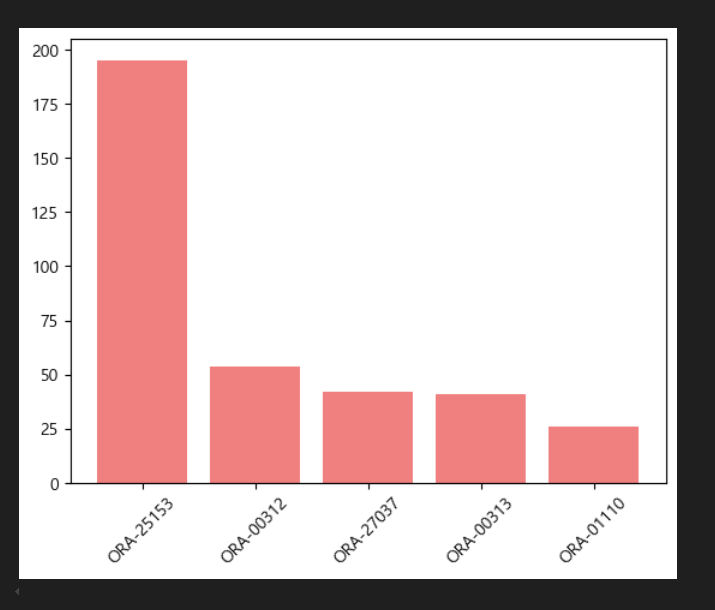
# 마지막 문제: 자동화 스크립트 2번을 아래의 막대 그래프를 출력하는 것으로 변경하시오.
# 실행되는 결과를 캡쳐해서 올리기.
from collections import Counter
import pandas as pd
import matplotlib.pyplot as plt
oracle_alert = open("C:\\data\\alert_log.txt", encoding='utf8')
oracle_text=oracle_alert.read()
lines = oracle_text.split()
while True:
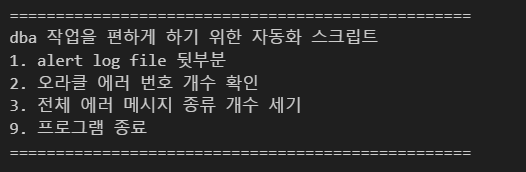
print("==================================================")
print('dba 작업을 편하게 하기 위한 자동화 스크립트')
print('1. alert log file 뒷부분')
print('2. 오라클 에러 번호 개수 확인')
print('3. 전체 에러 메시지 종류 개수 세기')
print('9. 프로그램 종료')
print('==================================================')
num=input('번호를 입력해주세요 : ')
if num == '1':
print(oracle_text[-700:])
break
elif num == '2':
error_list=[]
for i in lines:
if 'ORA-' in i:
error_list.append(i.strip(':'))
df_error= pd.DataFrame( list( Counter(error_list).items() ),columns=['에러번호','건수'])
df_error
df_sort = df_error.loc[ df_error.건수 >= 20 , : ].sort_values(by='건수', ascending=False)
x = df_sort.loc[ :, ['에러번호']]
y = df_sort.loc[ : , ['건수']]
plt.rcParams['font.family'] ='Malgun Gothic' # 한글 안깨지게 하는 코드
plt.bar(x['에러번호'],y['건수'], color='lightcoral')
plt.xticks(rotation=45)
plt.show()
break
elif num == '3':
for i in lines:
if 'ORA-' in i:
error_list.append(i.strip(':'))
print(Counter(error_list))
break
elif num =='9':
break
  |