Determination of the Popularity of Dietary Supplements Using Google Search Rankings
Mikołaj Kamiński,* Matylda Kręgielska-Narożna, and Paweł Bogdański
Author information Article notes Copyright and License information Disclaimer
Associated DataSupplementary Materials
https://www.ncbi.nlm.nih.gov/pmc/articles/PMC7231191/
2004~2019년동안의 구글 트렌드 검색량을 통한 비교.
200개의 건기식을 선정하고 크게 10개의 카테고리로 나눔
기준을 Lutein의 검색량을 1로 두고서 비교.
Abstract
The internet provides access to information about dietary supplements and allows their easy purchase. We aimed to rank the interest of Google users in dietary supplements and to determine the changes that occurred in their popularity from 2004 to 2019. We used Google Trends to generate data over time on regional interest in dietary supplements (n = 200). We categorized each included supplement and calculated the interest in all topics in proportion to the relative search volume (RSV) of “lutein”. We analyzed the trends over time of all topics and categories. Globally, the topics with the highest popularity were “magnesium”, which was 23.72 times more popular than “lutein”, “protein” (15.22 times more popular), and “iron” (15.12). The categories of supplements receiving most interest were protein (9.64), mineral (5.24), and vitamin (3.47). The RSV of seven categories of topics (amino acid, bacterial, botanical, fiber, mineral, protein, and vitamin) increased over time while two categories (enzyme and fat or fatty acid) saw a drop in their RSV. Overall, 119 topics saw an increase in interest over time, 19 remained stable, and 62 saw interest in them decrease. Google Trends provides insights into e-discourse and enables analysis of the differences in popularity of certain topics across countries and over time.
3. Results
Google users globally were most interested in topics representing the following categories: protein (9.64, express as a ratio with the value for “lutein”), mineral (5.24), and vitamin (3.47; Table 1). Of the 200 topics associated with dietary supplements, the most popular were “magnesium” (23.72), “protein” (15.22), “iron” (15.12), “calcium” (13.74), and “vitamin D” (12.22; Table 2 and Table S3).
Table 1
Popularity of categories of supplement-related topics in proportion to “lutein” (adjusted data; relative search volume (RSV) over time).
No.TopicNumber of Supplements in CategoryRatio of RSV to “Lutein”
| 1. | Protein | 2 | 9.64 |
| 2. | Mineral | 16 | 5.24 |
| 3. | Vitamin | 17 | 3.47 |
| 4. | Fiber | 2 | 3.01 |
| 5. | Chemical | 19 | 1.76 |
| 6. | Bacterial | 3 | 1.34 |
| 7. | Fat or fatty acid | 18 | 1.13 |
| 8. | Botanical | 91 | 0.97 |
| 9. | Amino acid | 24 | 0.86 |
| 10. | Enzyme | 8 | 0.48 |
Protein > Mineral > Vitamin > Fiber > Chemical > Bacterial(유산균) > Fat or Fatty acid > Botanical > Amino acid > Enzyme 순
이 분류는 https://dsld.od.nih.gov/dsld/index.jsp NIH 분류를 따름
Table 2
Popularity of the 20 most popular topics associated with dietary supplements, as a ratio with the value for “lutein” (adjusted data; relative search volume (RSV) over time).
No.TopicCategoryRatio of RSV to “Lutein”
| 1. | Magnesium | Mineral | 23.72 |
| 2. | Protein | Protein | 15.22 |
| 3. | Iron | Mineral | 15.12 |
| 4. | Calcium | Mineral | 13.74 |
| 5. | Vitamin D | Vitamin | 12.22 |
| 6. | Potassium | Mineral | 9.71 |
| 7. | Cobalamin | Vitamin | 9.36 |
| 8. | Caffeine | Chemical | 8.06 |
| 9. | Vitamin C | Vitamin | 7.38 |
| 10. | Omega-3 fatty acids | Fat or fatty acid | 6.80 |
| 11. | Creatine | Chemical | 6.77 |
| 12. | Folate | Vitamin | 6.67 |
| 13. | Zinc | Mineral | 6.36 |
| 14. | Aloe vera | Botanical | 6.11 |
| 15. | Ginger | Botanical | 5.91 |
| 16. | Dietary fiber | Fiber | 5.67 |
| 17. | Garlic | Botanical | 5.63 |
| 18. | Iodine | Mineral | 4.89 |
| 19. | Whey protein | Protein | 4.05 |
| 20. | Vitamin E | Vitamin | 3.86 |
200개 건기식중 검색량 상위 20개 항목
The mean proportion of a topic’s RSV to that of the topic “lutein” was positively associated with the total number of publications on the topic in PubMed in the years 2004–2019 (Rs = 0.34; p < 0.001; Figure 1).
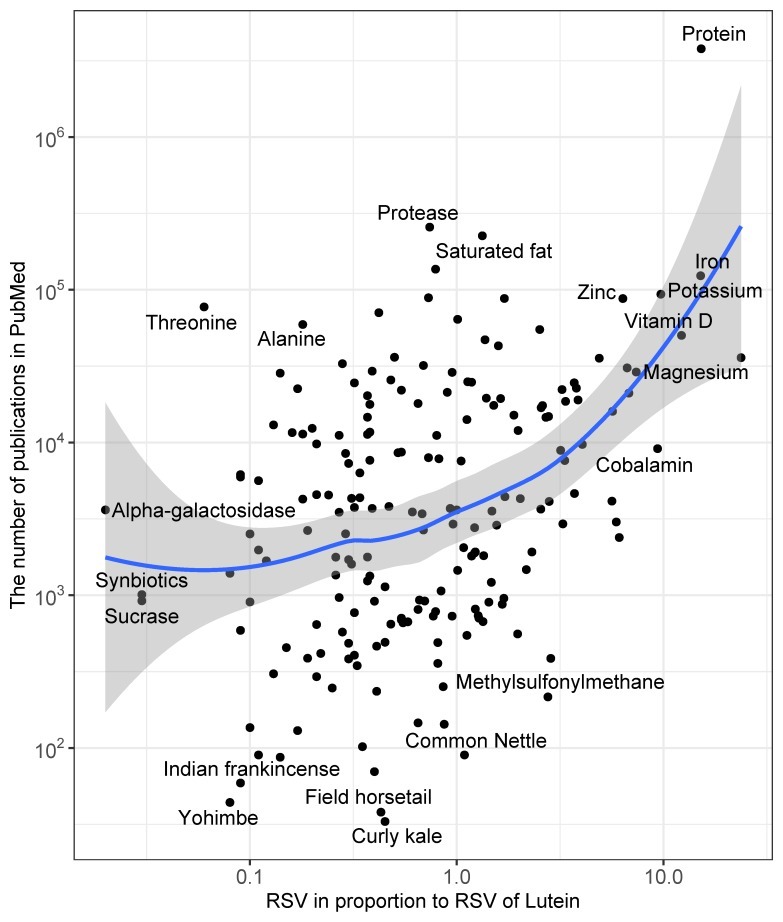
Correlation plot between the relative search volume (RSV) of each topic in proportion to the RSV of the topic “lutein” and the total number of publications in PubMed for the years 2004–2019. The plot gives the names of the topics which are outliers on the plot. The data are on an exponential scale.
구글 트렌드 검색량과 해당 건기식과 관련된 논문 발행량의 상관관계
검색량이 많을수록 발행된 논문의 편수가 많다.
A total of 149 of 250 countries and territories had low search volumes and were excluded from further analysis. Figure 2 shows the most commonly searched for topics across the 99 remaining regions. The most popular topic were “magnesium” (in 31 countries including South America, most European countries, Russia, and Turkey), “protein” (in 10 countries, mostly English speaking), “calcium” (in seven countries, including Egypt, Iran, and China), “aloe vera” and “glutathione” (in five countries), and “iron” (in four countries, including France, Israel, and Japan). Table S4 lists the ten most commonly searched for dietary supplement topics in each country.
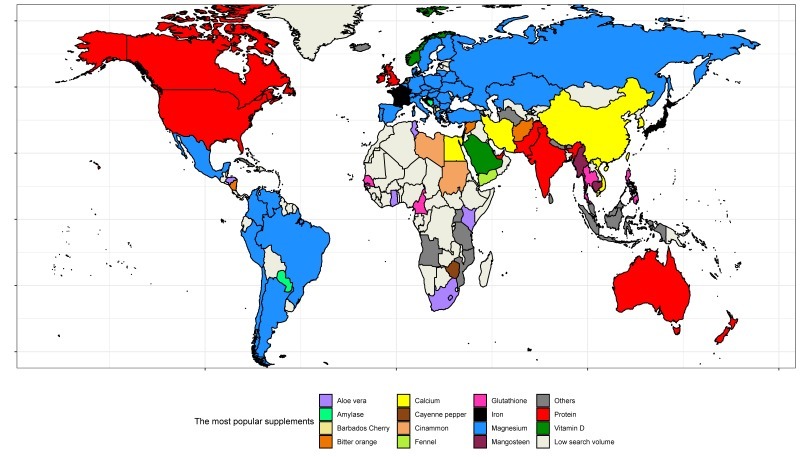
Supplements with the greatest interest by country. Countries with unique most popular supplements: Albania, boron; Angola, passion fruit; Armenia, burdock; Bhutan, cordyceps; Brunei, alfalfa; Cuba, chondroitin sulfate; Iceland, astaxanthin; Indonesia, garlic; Kosovo, iodine; Malaysia, vitamin C; Mauritius, holy basil; Montenegro, goji; Mozambique, Yohimbe; Nepal, ashwagandha; Netherlands, cobalamin; Sri Lanka, 4-aminobenzoic acid; Tanzania, nickel, Turkmenistan, glycine; Uganda, Beetroot.
국가와 대륙별로 가장 관심도가 높은 건기식이 달랐다.
미국과 캐나다는 Protein , 유럽과 남미는 마그네슘, 중국과 한국은 칼슘, 일본은 철분 등
We found that interest in seven categories of topics related to dietary supplements increased over time (amino acid, bacterial, botanical, fiber, mineral, protein, and vitamin), while interest in the fat or fatty acid category decreased over time. Interest in the enzyme and chemical categories remained stable (Figure 3 and Table 3). Interestingly, interest in all categories showed seasonal variation (Table 3). The greatest interest was generally seen in February and March, and the lowest interest was observed in December. The time-series analysis of all 200 topics related to dietary supplements is presented in Table S5. Overall, interest in 120 topics increased over time, while 17 were stable, and 63 decreased in interest. The greatest increase over time was observed for the topics “vitamin K2” (6.11 RSV/year), “cinnamon” (5.42 RSV/year), “turmeric” (5.12 RSV/year), and “probiotic” (5.07 RSV/year). The greatest decrease in interest was noted for the topics “female ginseng” (−3.70 RSV/year), “methylsulfonylmethane” (−3.60 RSV/year), “protease” (−3.44 RSV/year), and “yohimbe” (−3.43 RSV/year). The trends of the 20 most popular topics are presented in Figure 4.
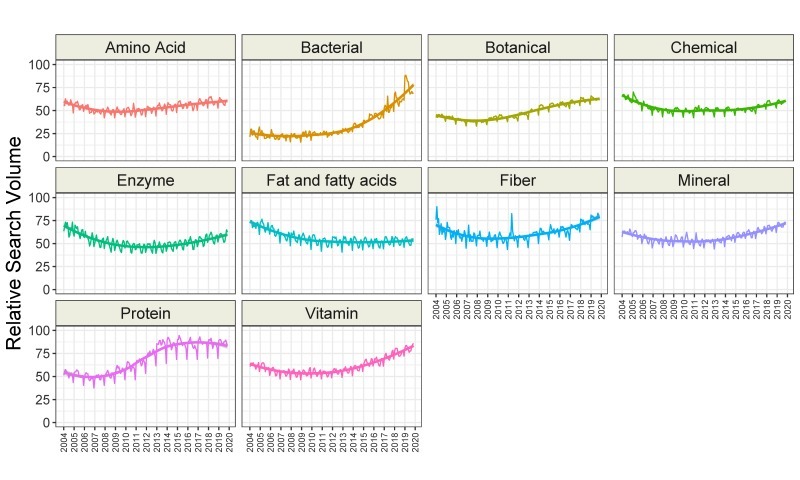
Time trends of relative search volumes of categories of dietary supplement-related topics.
카테고리별 검색량 비교
유산균의 검색량 상승이 돋보임. 유산균, 식이섬유, 미네랄, 단백질, 비타민 상승
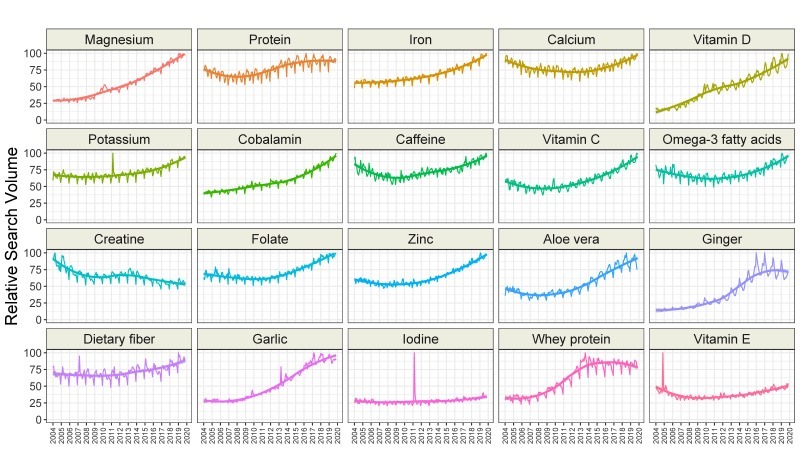
Time trends for relative search volumes of the twenty most popular dietary supplement-related topics.
Table 2에서 보았던 가장 검색량이 많았던 건기식 20개 항목의
2004~2020년 동안의 연도별 검색량 변동 추이
대부분의 항목들이 검색량이 많아지고 있는 편이다. 마그네슘, 단백질, 철, 칼슘, 비타민D, 칼륨, 코발라민, 카페인, 비타민C, 오메가3, 엽산, 아연, 알로에 베라, 생강, 식이섬유, 마늘, 유청단백질
몇개의 항목들은 변화가 없거나 하락중이다. 크레아틴, 요오드, 비타민E
Table 3
Time series analysis of categories of topics related to dietary supplements.
TopicSeasonal Mann–Kendall TestSlope (RSV/Year)TBATS (Seasonality Present, Period (month))Month with the Highest Seasonal Component (RSV)Month with the Lowest Seasonal Component (RSV)Seasonal Component Amplitude (RSV)
| Amino acid | tau = 0.44; *** | 0.47; *** | YES, 12 | March (3.04) | December (−6.57) | 9.61 |
| Bacterial | tau = 0.77; *** | 2.91; *** | YES, 12 | February (3.97) | December (−3.73) | 7.70 |
| Botanical | tau = 0.76; *** | 1.66; *** | YES, 12 | March (1.88) | December (−5.36) | 7.24 |
| Chemical | tau = 0.05; 0.307 | - | YES, 12 | February (2.51) | December (−6.08) | 8.59 |
| Enzyme | tau = −0.06; 0.228 | - | YES, 12 | October (4.06) | August (−6.82) | 10.88 |
| Fat or fatty acid | tau = −0.58; *** | −1.05; *** | YES, 12 | March (4.51) | December (−8.40) | 12.91 |
| Fiber | tau = 0.39; *** | 0.77; *** | YES, 12 | March (4.66) | December (−9.91) | 14.57 |
| Mineral | tau = 0.37; *** | 0.68; *** | YES, 12 | March (3.47) | December (−6.55) | 10.02 |
| Protein | tau = 0.74; *** | 3.11; *** | YES, 12 | March (5.07) | December (−14.02) | 19.09 |
| Vitamin | tau = 0.52; *** | 1.31; *** | YES, 12 | March (3.37) | December (−6.31) | 9.68 |
*** p-value < 0.001. TBATS—exponential smoothing state-space model with the Box–Cox transformation, autoregressive-moving average errors, trend, and seasonal component.